When you have a "mystery" bug to solve, tracepoints are a vital part of your debugging arsenal. Single stepping and looking through code can be S-L-O-O-O-O-W and if you don't even know what you're looking for, it can consume hours and hours of effort. Tracepoints really speed things up. They're like breakpoints that don't break. In a way, they go back to the old "printf debugging" -- but you don't need to make code changes and recompile to change them.
To set a tracepoint, first set a breakpoint, then right-click on the red dot that appears in the margin and choose When Hit:
In the dialog that appears, click the Print A Message box and edit the starter message you are given. You can include any expression in braces and it will be evaluated when control reaches the tracepoint:
Leave the Continue Execution box checked so that you don't break. Tracepoints are identified by red diamonds instead of red dots:
The output from the tracepoints appears in the output window of your debug session:
You can set up something suspicious, let it run, then pore through the tracepoint output and see what you learn. It's a huge timesaver when you're tackling a "we don't even know where to start" bug. Plus, if the issue is related to threading or async issues in any way (and you know me, I keep preaching we will all be facing async issues eventually) then you don't have to worry that pausing execution suppresses the collisions. I recently helped a client solve a big hairy this-stuff-fails-for-our-biggest-customer-only bug using tracepoints... and a few other tricks I will cover in upcoming posts.
Conditional breakpoints
Conditional breakpoints were another really important tool in solving a recent "only happens at the big installations" bug in a big and complicated C++ application. We wanted to debug the code with as few rebuilds as possible and we really didn't know how parts of it worked at all. Tracepoints helped us to figure out a lot of it in a short time. We didn't have a decent repro case though, so here's what we did:
- created a script to add an audit table and some triggers that write to it
- created a script to remove those triggers and the table
- created a batch file to run a server in verbose mode, and redirect the output to a text file (remembering DOS commands sure can be helpful... myapp.exe -verbose >logfile.txt was the magic phrase.)
- wrote some instructions for the support guy to grab a backup of the database, run the first script, run the batch file, let it run all night, then in the morning grab another backup of the database, run the second script, and stop the batch file.
Now we ran some queries on the morning version of the database to confirm that at least one X was missing a Y that should have been calculated overnight. We even had the Xid. Thanks to the tracepoint work of the previous day we knew where to be suspicious. A little digging in the trigger output told us whether the problem was "didn't get added" or "got added, but then got deleted". The last step was conditional breakpoints. These let us say "only stop here when you're processing the X with this Xid."
This really saves time when you just need to drill into what's happening in the case that is going wrong. You get to it by right clicking the red dot or diamond and choosing Condition.
One more breakpoint tip - hit count
Conditional breakpoints are cool when you know the value of one variable that is associated with trouble: this only blows up when Xid is 1234. They can also be used to reduce the boredom of single stepping. Say you've got some loop that goes around a few hundred times building up some string or array or something. You don't want to keep going round and round and round... it would be nice to jump ahead to halfway through, for example, and see how things are looking. Now if this is a for loop with a handy named variable, say
for (int i = 0; i<1000; i++)
Then you can use a conditional breakpoint and say "stop when i is 200". Or you could be clever and stop when i % 200 is 0 -- so that's every 200 times. But what if there's no i? What if you're going through a file or a recordset/dataset/resultset and you're going until the end? You don't want to add some fake variable that gets incremented each time through the loop, just so you can set a breakpoint that breaks on certain values of that variable. Instead you want to use the hit count property of the breakpoint. Just right click the red dot and choose Hit Count. There you can set the breakpoint to break whenever it's hit, just the 10th time it's hit, every tenth time (10, 20, 30 etc) or every time after the 10th time Or, of course, whatever number you want instead of 10:
Don't debug the slow way when there are tools to make you so much faster!
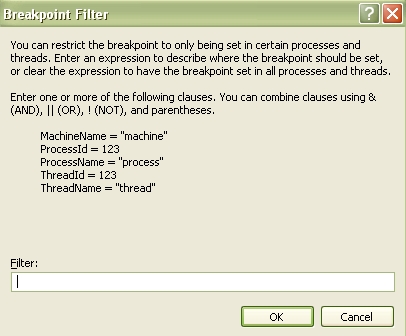
Filter 下次再介绍:
注意:c#的也可以用的啊....
来自:http://www.gregcons.com/KateBlog/CategoryView.aspx?category=C%2B%2B