gperftools是Google提供的一套工具,其中的一个功能是CPU profiler,用于分析程序性能,找到程序的性能瓶颈。
Graphviz是一个由AT&T实验室启动的开源工具包,用于绘制DOT语言脚本描述的图形,gperftools依靠此工具生成图形分析结果。
安装命令:yum install graphviz
编译google-perftools
因为我们只需要tcmalloc功能,因此不编译google-perftools中的其他工具。
wget http://gperftools.googlecode.com/files/google-perftools-1.9.1.tar.gz
tar -xvzf google-perftools-1.9.1.tar.gz
cd google-perftools-1.9.1
./configure –disable-cpu-profiler –disable-heap-profiler –disable-heap-checker –enable-minimal–disable-dependency-tracking
make
makeinstall
/sbin/ldconfig
用法
1.目标程序中引入头文件
示例:
#include <google/profiler.h> #include <iostream> using namespace std; void func1() { int i = 0; while (i < 100000) { ++i; } } void func2() { int i = 0; while (i < 200000) { ++i; } } void func3() { for (int i = 0; i < 1000; ++i) { func1(); func2(); } } int main(){ ProfilerStart("my.prof"); // 指定所生成的profile文件名 func3(); ProfilerStop(); // 结束profiling return 0; }
- 1
- 2
- 3
- 4
- 5
- 6
- 7
- 8
- 9
- 10
- 11
- 12
- 13
- 14
- 15
- 16
- 17
- 18
- 19
- 20
- 21
- 22
- 23
- 24
- 25
- 26
- 27
然后编译链接运行,使用pprof生成分析结果
g++-o demo demo.cpp -lprofiler
运行demo,生成my.prof文件,然后用pprof命令对该文件解析,生成结果txt或pdf等。
pprof–text ./demo my.prof > output.txt
pprof–pdf ./demo my.prof > output.pdf
pdf格式的比较直观
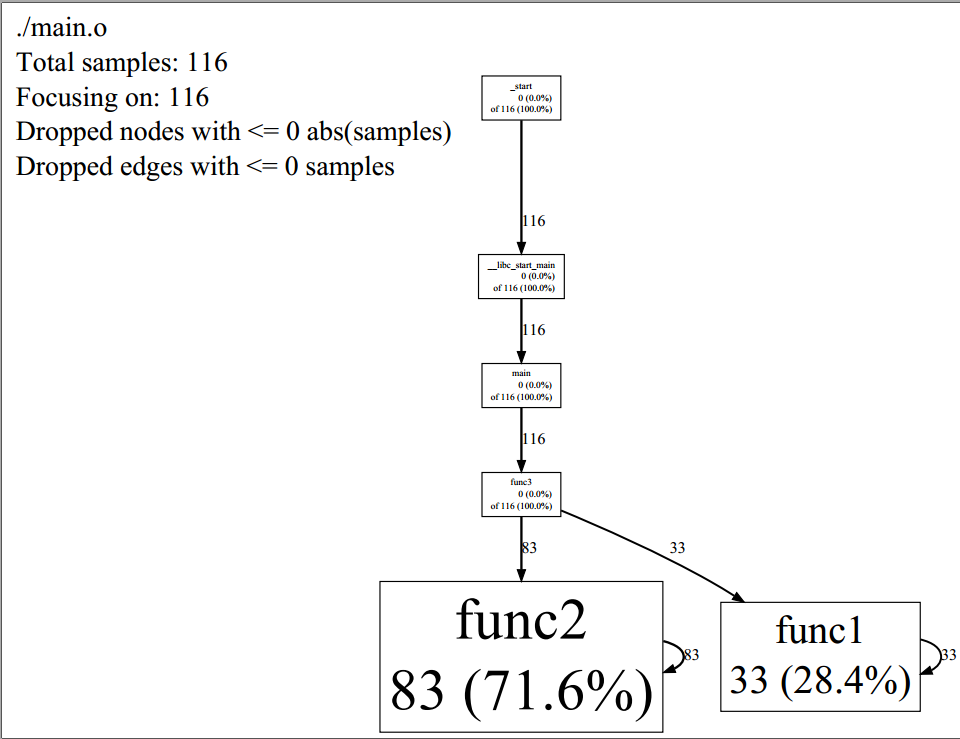
图形风格的结果由节点和有向边组成,
每个节点代表一个函数,节点数据格式:
Class Name
Method Name
local (percentage)
of cumulative (percentage)
local时间是函数直接执行的指令所消耗的CPU时间(包括内联函数)。性能分析通过抽样方法完成,默认是1秒100个样本,一个样本是10毫秒,即时间单位是10毫秒;cumulative时间是local时间与其他函数调用的总和;如果cumulative时间与local时间相同,则不打印cumulative时间项。
有向边:调用者指向被调用者,有向边上的时间表示被调用者所消耗的CPU时间
如果生成pdf时报错:ps2pdf command not found,那么要安装Ghostscript。
下载地址:
http://www.linuxfromscratch.org/blfs/view/cvs/pst/gs.html
百度地址:
http://pan.baidu.com/s/1hsP2N56#list/path=%2F
安装的时间会很长,要耐心等待。
文本风格输出结果
Total: 116 samples
83 71.6% 71.6% 83 71.6% func2
33 28.4% 100.0% 33 28.4% func1
0 0.0% 100.0% 116 100.0% __libc_start_main
0 0.0% 100.0% 116 100.0% _start
0 0.0% 100.0% 116 100.0% func3
0 0.0% 100.0% 116 100.0% main
一共6列,分别代表的意思是:
分析样本数量(不包含其他函数调用)
分析样本百分比(不包含其他函数调用)
目前为止的分析样本百分比(不包含其他函数调用)
分析样本数量(包含其他函数调用)
分析样本百分比(包含其他函数调用)
函数名
注意:
gperftools需要程序正常退出才能向prof文件打印数据,所以当程序无法退出时,得要发送信号给进程,在接到信号后,调用ProfilerStop();函数,才能打印出数据。如下所示:
void signal_handler(int signo) { signal(signo, signal_handler); INFO_LOG("recv signal[%d]", signo); switch(signo) { case SIGTERM: //程序自己退出,或shell里调用kill缺省该进程。该信号可以被阻塞,或被处理 //可以在这里做一些程序退出前的最后处理工作 ProfilerStop(); INFO_LOG("Process recieve SIGTERM"); break; } exit(0); } //主函数 signal(SIGTERM, &signal_handler);
- 1
- 2
- 3
- 4
- 5
- 6
- 7
- 8
- 9
- 10
- 11
- 12
- 13
- 14
- 15
- 16
- 17
用valgrind的callgrind工具也可以进行分析程序性能。
分享一个教程:http://www.tuicool.com/articles/nUZJBb2